Visual Knowledge and Cultural Bias
Visual forms are never neutral. Every diagram, chart, or image carries cultural assumptions about what knowledge is and how it should look. From geometry to Google Maps, people have used images not just to show information but to organize and control knowledge.
We must study images as interpretive systems, not as transparent mirrors of truth. Visual knowledge is constructed — shaped by values, technologies, and worldviews. She calls for a humanistic approach to visualization: one that recognizes meaning as situated and subjective, not universal or purely mathematical.
“Every visualization is an argument, not a window on reality.”
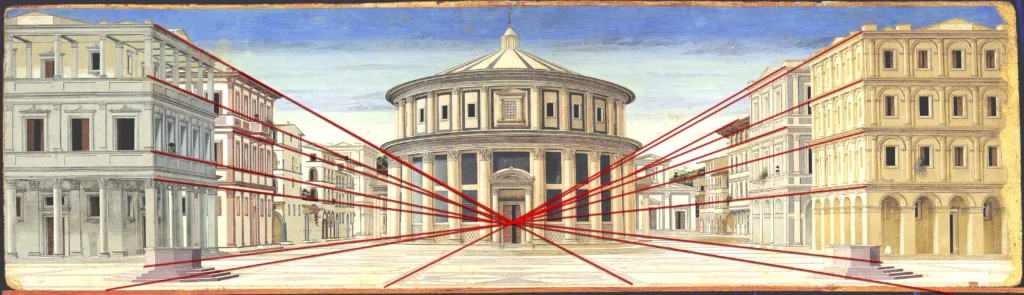
- Renaissance perspective made the viewer the center of space — a model of human dominance.
- Modern data graphics suggest objectivity, but they rely on design choices, color scales, and framing.
- Maps and charts hide the politics of what they exclude.
Thus, seeing is not neutral; it is a cultural act shaped by power, language, and ideology.
The Language of Graphics: Searching for Rules
Throughout history, scholars have tried to find a universal grammar of visual communication — a way to make images function like language, with rules and syntax.
Philosophers and artists from the Renaissance to the Bauhaus believed that visual forms could express truth mathematically. Geometry and proportion were seen as bridges between art and science. Perspective drawings, color wheels, and design grids were all efforts to rationalize vision.
In the 20th century, this search continued in new forms. Wassily Kandisnky and Paul Klee at the Bauhaus studied how shapes and colors evoke emotional and psychological effects. For them, visual form had a kind of spiritual grammar.
Ferdinand de Saussure and later semioticians inspired the idea that visual elements could act as signs, just like words. Jocques Bertin’s “Semiology of Graphics (1967) proposed a systematic visual language for data: position, size, color, and shape as “visual variables.”
Be aware: Such systems treat images as if they have fixed meanings. In reality, interpretation depends on context and culture. Indeed. A color may signal “danger” in one society and “good luck” in another. A map projection can distort the world to favor one region over another.
So while the “grammar of graphics” is useful for design and analysis, it must be understood as a rhetoric, not a code — a way of persuasion, not an absolute truth.
Knowledge and Vision: Seeing as Understanding
Western culture has long linked vision with knowledge — “seeing is believing”. From Plato’s cave to Enlightenment science, truth has often been imagined as something we see clearly.
Historical Roots of Visual Knowledge
In classical philosophy, geometry was the highest form of knowledge because it expressed eternal forms through sight and logic. Renaissance artists like Alberti and Leonardo turned this idea into practice through linear perspective — a system that placed the human observer at the center of a rational, measurable world. Modern science inherited this model: instruments like the telescope or microscope extend human sight, promising objective truth.
This tradition also encodes hierarchies and prioritizes the eye as an instrument of power. To “see” becomes to “know”, and to know becomes to “control”. Visual systems — maps, anatomical drawings, colonial surveys — have historically served authority, not neutrality. What is visible (and what is left invisible) is a political choice.
Further Reading
This is a note.
This is a warning.
This is dangerous.